El Niño and La Niña: What They Mean and How They Differ
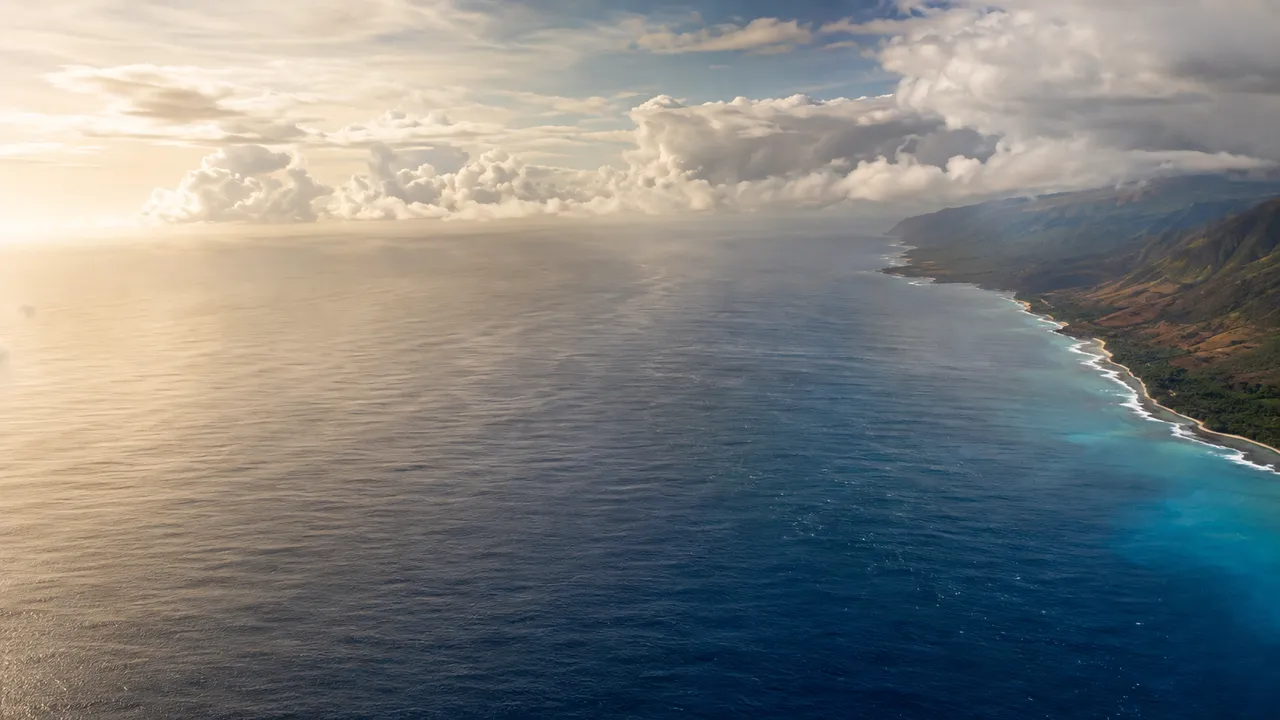
Every few years, sea surface temperatures across the central and eastern Pacific shift – sometimes warmer than the long-term average, sometimes cooler. What is El Niño in physical terms – the warm phase of that cycle: ocean temperatures in the central and eastern Pacific rise above normal, trade winds weaken and rainfall patterns across multiple continents reorganise in response. La Niña is the opposite state – the same stretch of ocean runs colder than normal, trade winds strengthen and the atmosphere adjusts accordingly.
How the ENSO Cycle Works
This complete system is designated as the El Niño–Southern Oscillation (ENSO) by scientific researchers who study weather patterns. Indeed, it has been observed that the El Niño–Southern Oscillation shifts between three distinct stages of neutral, warm, and cool conditions because of the connection that binds Pacific ocean surface warmth with the air mass resting overhead.
Neutral Conditions in the Tropical Pacific
In a neutral year, trade winds push steadily westward. Warm water piles up near Indonesia. Off Peru and Ecuador, cold water stays near the surface, kept there by upwelling from deeper layers. Rain follows the warm pool west.
Around four in ten years sit near this baseline. It looks stable. But it takes very little to tip it.
Trade Winds, Upwelling and Ocean-Atmosphere Feedback
In neutral conditions, trade winds push enough warm water westward that sea level near Indonesia sits roughly 20 centimetres higher than near Peru. The thermocline – the boundary between warm surface water and cold deep water – tilts upward toward the east, keeping cold nutrient-rich water close enough to the surface that Peru's fisheries depend on it.
Jacob Bjerknes described what happens when that balance breaks in a 1969 paper. A small warming in the eastern Pacific reduces the temperature gradient between east and west. That reduced gradient weakens the trade winds. Weaker winds mean less westward water transport, shallower upwelling off Peru, warmer surface temperatures – which weaken the winds further. Each part of the system changes the other continuously, which is why a modest initial perturbation can tip the Pacific into a full El Niño within months.
What Is the Difference Between El Nino and La Nina?
The El Niño and La Niña difference is often described as warm versus cool, which is accurate but leaves out most of what matters – where the Pacific tips, by how much, and what the atmosphere reorganises around in response.
El Nino as the Warm Phase of ENSO
Central Pacific sea surface temperatures during 2015-16 ran more than 2°C above the long-term average. That gap – held for months across a large stretch of ocean – was enough to shift the position of major rainfall systems, weaken the Indian monsoon's pressure gradient and alter hurricane activity in the Atlantic simultaneously. El Niño meaning in physical terms: trade winds have slackened, warm water has spread east, and the thermocline – the boundary separating warm surface water from cold deeper water – has tilted so that cold water no longer reaches the surface off South America.
La Nina as the Cool Phase of ENSO
La Niña meaning starts with the opposite surface condition. Trade winds intensify rather than weaken. Upwelling off Peru and Ecuador deepens, drawing cold water to the surface across a wider band of the eastern Pacific. The warm pool pulls back west; rainfall follows it. One aspect of the difference between El Niño and La Niña that catches people off guard: La Niña episodes frequently run two to three consecutive years, while El Niño tends to resolve within a single cycle.
El Nino and La Nina Effects on Global Weather

Most of the world's population lives nowhere near the tropical Pacific. The El Nino and La Nina effect reaches them anyway – not through direct temperature change but through shifts in where the atmosphere's main rainfall and pressure systems sit.
Temperature and Rainfall Patterns
Historically, at least half of all El Niño years produced drought conditions in India – below 90% of the long-term precipitation average. The other half did not. The 1997-98 El Niño was the strongest of the 20th century, yet India recorded above-average monsoon rainfall that year. A strongly positive Indian Ocean Dipole simultaneously pushed extra moisture toward the subcontinent and cancelled out the Pacific signal entirely.
What the La Niña effect is for South Asia is more consistent: during the 16 La Niña years between 1950 and 2012, Indian summer rains ran above or around average nearly every time. The asymmetry matters – La Niña's strengthening of the monsoon is a more reliable signal than El Niño's suppression of it. Farmers and travellers checking an India weather forecast during an ENSO year are reading a probability, not a guarantee.
Droughts, Floods and Tropical Cyclones
In 1972, the El Niño that collapsed Peru's anchovy fishery also produced one of India's worst droughts of the century. Across the Pacific, Indonesia and Australia dried out simultaneously. Coastal Peru flooded. In the Atlantic, stronger upper-level winds increased wind shear – the speed and direction difference between atmospheric layers – dismantling developing storms before they could organise. That year's Atlantic hurricane season was among the quietest on record.
Why Regional Effects Vary Between Events
Two El Nino events at similar strength can produce different results in the same region. Season matters. A developing event in boreal spring affects different circulation patterns than one peaking in December. Other climate modes – the Indian Ocean Dipole, the Pacific Decadal Oscillation – are running in the background and can amplify or suppress what ENSO would otherwise do.
Effects on Marine Ecosystems and Fisheries
Off the coast of Peru, the fishery does not wait for a forecast. When upwelling slows during El Nino, cold nutrient-rich water stops reaching the surface. Phytoplankton blooms collapse. Anchoveta – a small fish that feeds on those blooms and supports one of the world's largest fisheries – disappears from its usual grounds.
The 1972 El Nino triggered exactly this. Peru's anchovy catch fell so sharply that global fishmeal markets restructured almost overnight. It remains one of the clearest examples of how a Pacific temperature anomaly translates into an economic event thousands of kilometres away.
La Nina brings the reverse. Stronger upwelling, colder water, more nutrients. Fish stocks recover. The difference between a good and a bad fishing year on the Peruvian coast often comes down to which phase the Pacific is in.
How El Nino and La Nina Are Monitored and Forecast
The standard reference zone is the Niño 3.4 region – a defined patch of the central Pacific. When sea surface temperatures there stay more than 0.5°C above average for several consecutive months, El Nino conditions are confirmed. Below −0.5°C, La Nina. The index tracking this is called the Oceanic Niño Index, or ONI.
Forecasters can typically flag a developing event six to twelve months ahead. Confidence drops beyond that window. The cycle's timing is irregular enough that even well-initialized models struggle past a certain lead time.
El Nino and La Nina run on the same engine. One pushes the Pacific warm, the other pulls it cool – and the atmosphere reorganizes around whichever state takes hold. How far that reorganization reaches depends on the event's strength, the time of year, and what other climate patterns are already running. No two cycles land the same way.
Check current seasonal forecasts for your region at MeteoFlow before planning around a monsoon, a dry season, or a hurricane window.
FAQ
Can El Nino and La Nina affect air quality?
Wildfire smoke is the main route. El Nino dries out Indonesia, Australia and parts of equatorial Africa – and dry vegetation burns. In 1997-98, fires across Borneo and Sumatra sent smoke across Southeast Asia for months. Several countries recorded their worst air quality figures in decades that year.
Are El Nino and La Nina caused by climate change?
The cycle was running long before industrialisation – paleoclimate records trace it back thousands of years. Whether warming temperatures are making strong events stronger is a live research question with no settled answer yet. But the cycle's existence owes nothing to human emissions.
Can El Nino and La Nina affect food prices?
The 1972 El Nino offers the clearest example. Peru's anchovy fishery collapsed, fishmeal became scarce, and soybean prices jumped as buyers scrambled for alternatives – all within a single season. Grain markets have moved for similar reasons when El Nino drought hits major wheat or maize-producing regions at the wrong time of year.
How can El Nino and La Nina affect human health?
Mainly through what they do to water. Heavier rainfall in parts of South America during El Nino years expands mosquito habitat, which has been linked to higher dengue and malaria rates. Drought raises a different set of risks – water scarcity, crop failure, smoke from fires. Which effect dominates depends on the region and the strength of the event.


