How Do Weather Websites Measure Local Air Pressure Changes?
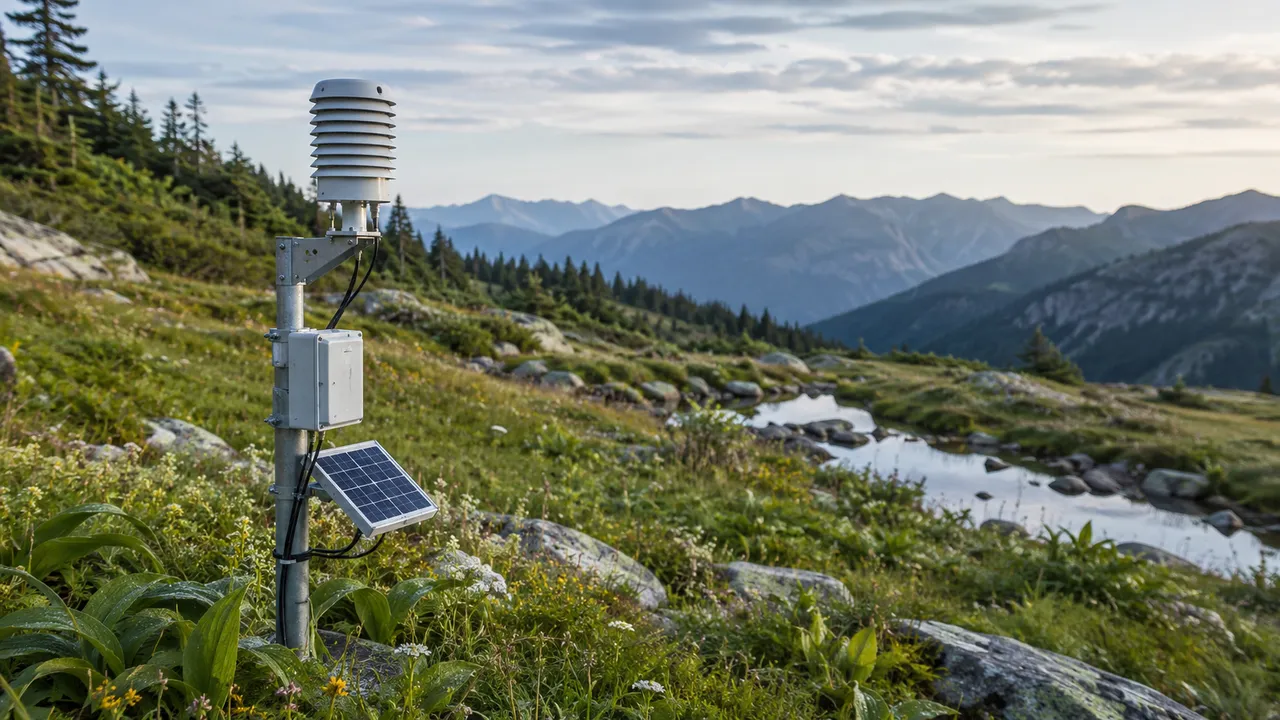
A number appears on the screen – 1,013 hPa, or maybe 1,008. It looks precise. But where does it actually come from, and how much should you trust it for your specific street? Behind every pressure reading on a weather site sits a chain of hardware, calibration steps, and data networks that most users never see. Understanding that chain is what separates a number you glance at from one you can act on.
The Sensors Behind the Reading
Modern weather stations use two main sensor types to measure atmospheric pressure. The most common in professional networks is the silicon MEMS sensor – a micro-electromechanical device smaller than a fingernail that detects pressure through changes in electrical capacitance as a flexible diaphragm shifts. These sensors can resolve pressure differences of 0.1 hPa – fine enough to register moving from one floor of a building to the next.
The second type is the aneroid barometer: a sealed metal chamber that physically compresses and expands as pressure changes. No liquid, no moving parts beyond the chamber itself. Aneroid mechanisms have been used in digital barometer weather station sensor setups for over a century precisely because they're mechanically stable across a wide temperature range.
How Stations Prevent False Readings
Wind passing any object creates a localised low-pressure zone around it. A sensor sitting exposed in a 50 km/h gust can register 2-4 hPa below the actual atmospheric pressure – the difference between a reading that says "clear conditions" and one that triggers a storm alert.
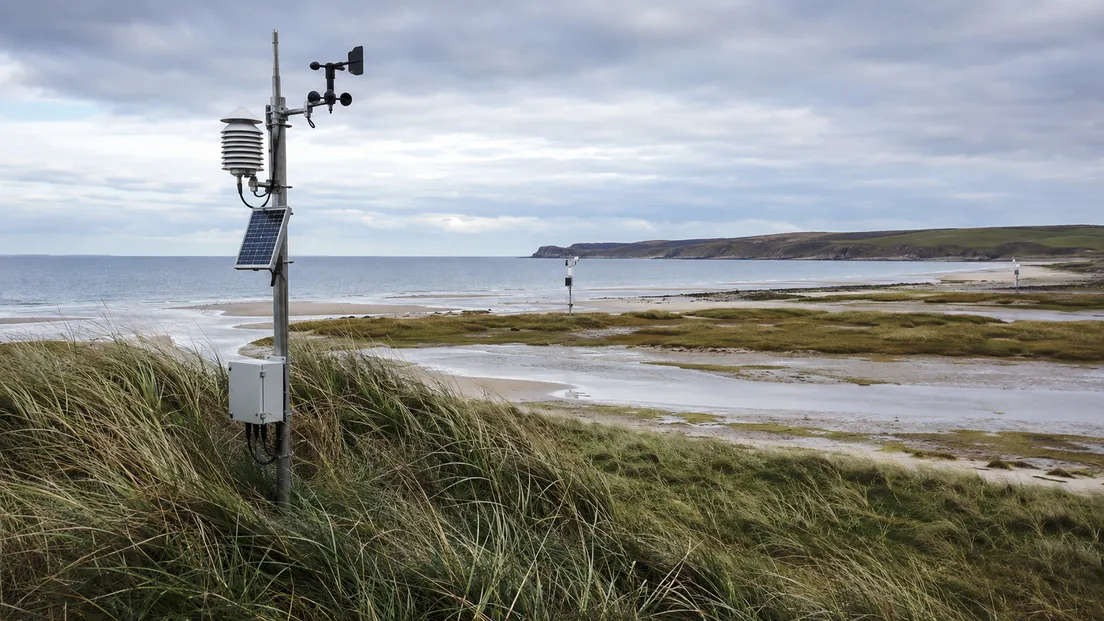
Static pressure heads are the hardware fix. These vented housings surround the sensor and channel air from multiple directions simultaneously, so no single gust dominates the reading. The result is a measurement of the surrounding atmosphere, not of the airflow velocity at that particular spot. Coastal stations and hilltop installations rely on them most – locations where exposed sensors would produce unreliable data on any windy day, which in those environments is most days.
How the Data Reaches a Weather Website
More than 10,000 land-based stations worldwide transmit pressure data through the WMO's SYNOP network every six hours – and that's before adding airport METAR reports, which update every 30 minutes at most commercial airports and every hour at smaller ones. Weather websites pull from this air pressure measurement weather network alongside data from commercial sensor networks that fill gaps between official stations.
Each reading arrives with a timestamp, a station ID, and an elevation figure. The data is quality-checked against neighbouring stations – an outlier that disagrees by more than a set threshold gets flagged before it enters any forecast model. MeteoFlow draws on these calibrated networks to display local pressure readings tied to the user's coordinates rather than the nearest city centre.
Track real-time local pressure trends and changes on MeteoFlow before weather conditions shift.
Why All Readings Are Adjusted to Sea Level
A station sitting at 500 metres elevation will read roughly 60 hPa lower than a coastal station at sea level during the same weather system – not because the weather differs, but because there's simply less atmosphere above it. Raw readings from stations at different altitudes can't be compared directly.
Meteorologists apply a mathematical correction based on the International Standard Atmosphere formula – approximately 12 hPa per 100 metres near the surface – to convert every raw reading to what it would be at sea level. This standardised figure is called mean sea-level pressure, or MSLP. Without it, isobar maps would trace the shape of the terrain rather than the atmospheric pressure systems that actually drive weather. A mountain range would look like a permanent low-pressure zone even on a perfectly calm day.
How MeteoFlow Uses Pressure Data
1,008 hPa falling for three hours and 1,008 hPa holding steady since morning are the same number with completely different implications. MeteoFlow's trend indicator – rising, steady, or falling – makes that distinction immediately visible without requiring the user to compare readings manually across time.
Hourly pressure graphs go further. A fall of 1-2 hPa per hour typically means a low-pressure system is closing in. Push that rate to 3-4 hPa within a single hour and the signal shifts toward something more intense developing in the area. Those patterns show up in the graph before they show up outside – which is the point of tracking pressure rather than just glancing at it.
Use MeteoFlow to track local barometric pressure trends and anticipate incoming weather before it arrives.
FAQ
Why does the air pressure reading differ between two weather apps for the same location?
Different apps pull from different station networks with varying coverage density and update intervals. They may also apply slightly different sea-level correction algorithms. A discrepancy of 1-3 hPa between platforms for the same location is normal and reflects network differences rather than measurement error.
What does it mean when a weather site shows pressure in hPa versus mbar?
Numerically identical – 1 hPa equals exactly 1 millibar. Modern meteorological services use hPa as the SI-compatible designation; older instruments and some data sources still display mbar. Switching between them on a forecast site changes the label, not the value.
How often does MeteoFlow update its local pressure readings?
Update frequency depends on the data source and location. Airport METAR stations report every 30 minutes at major airports; SYNOP network stations transmit every six hours; commercial sensor networks in urban areas typically update every 10-30 minutes. MeteoFlow pulls from whichever source provides the most current data for a given location.


