What Weather Data Sources Do Online Forecast Services Use?
Two apps, same city, different forecasts. One says rain at 3pm; the other shows clouds clearing by noon. Neither is obviously wrong – they're drawing on different weather data sources forecast models and processing them differently. Understanding what sits behind a forecast is the most direct way to judge which service deserves your trust for a specific use case.
Global Observation Networks: The Raw Input
Twice a day, around 900 instrument packages ride weather balloons to 35 kilometres, transmitting temperature, humidity, and wind readings every few seconds on the way up. When the balloon bursts, the package parachutes back down – the data is already transmitted. No other method samples the full vertical column of the atmosphere at that resolution across so many locations simultaneously.
On the ground, surface stations fill in conditions at land level. Buoys do the same across the open ocean. Commercial aircraft add a third layer through the AMDAR programme: planes already flying their routes report atmospheric data at cruise altitude – around 700,000 observations per day across every major air corridor. Each reading arrives with a timestamp and coordinates, feeding into the assimilation systems that stitch individual observations into a working model of the atmosphere at a given moment.
Satellites and Radar: Eyes on the Atmosphere
Satellites give the big picture; radar gives the street-level detail. Neither does the other's job, which is why serious forecast services use both as part of the satellite radar weather observation network behind their output.
Geostationary satellites – Meteosat over Europe and Africa, GOES over the Americas – hold position above a fixed point and deliver continuous imaging of cloud cover, moisture, and surface temperature across roughly a third of the planet at once. Polar-orbiting satellites trade that continuity for detail, passing over every point on Earth twice a day and capturing finer vertical temperature and humidity profiles.
Radar operates at the opposite scale. Updated every 5-10 minutes, it shows what precipitation is doing right now at a specific location – intensity, movement direction, storm cell structure. A model forecast might predict rain arriving at 4pm; radar tells you it's 20 minutes away and moving at 45 km/h toward your postcode.
Government Numerical Weather Models
ECMWF and NOAA's GFS are the two global models most forecast services build on – and most services don't build their own from scratch. Running a competitive global numerical model requires petabytes of observation data, physics-based atmospheric simulation running across millions of grid points, and supercomputing infrastructure that only a handful of institutions maintain.
ECMWF, based in the UK, is widely regarded as the most accurate global model for forecasts in the 5-10 day range. GFS from NOAA updates four times daily and projects 16 days ahead with global coverage. Both ingest the radiosonde, satellite, buoy, and aircraft data described above, run forward simulations of how the atmosphere will evolve, and release their output for use by forecast services around the world.
See how MeteoFlow combines these data sources for your exact location in real time.
Proprietary Algorithms and Local Refinement
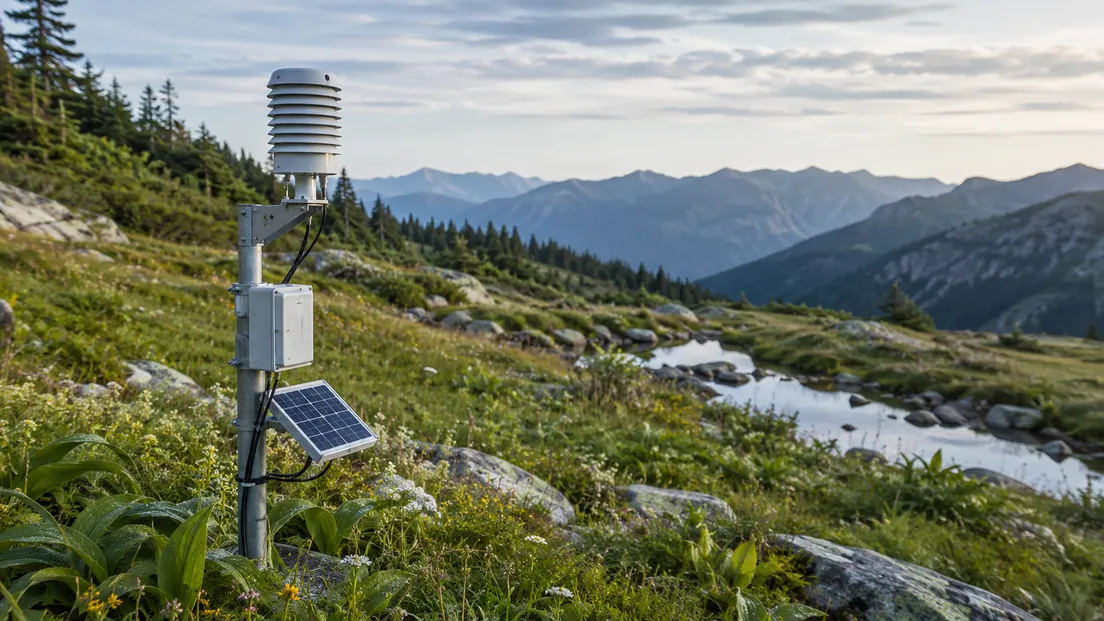
Two services using the same ECMWF output can still produce different forecasts – because the raw model output is not the finished product. Post-processing is where local accuracy is won or lost.
Model Output Statistics (MOS) is the established technique: a statistical layer trained on historical model errors at specific locations that corrects known biases before the forecast reaches the user. ECMWF consistently underestimates rainfall intensity in mountain valleys, for example – local MOS correction adjusts for that pattern automatically.
Machine learning adds a second layer, identifying error patterns that statistical post-processing misses – particularly in areas with complex terrain, urban heat islands, or coastlines where model grid resolution is too coarse to capture local effects. The same base model, processed differently, produces a meaningfully different number on the screen.
How MeteoFlow Sources and Processes Weather Data
MeteoFlow delivers forecasts tied to GPS coordinates rather than city-level averages, combining output from established global models with regional radar data and local station readings where coverage allows.
Location-based refinement applies on top of that raw input – correcting for the terrain, elevation, and proximity to water that affect conditions at the user's specific point rather than the wider grid cell it sits in. The result is a forecast that reflects what's happening at the address, not what a model calculated for the surrounding 10-kilometre square.
Use MeteoFlow to access forecasts built on calibrated data sources and refined for your exact location.
FAQ
Why do different weather apps show different forecasts for the same location?
Different services use different base models – ECMWF, GFS, or regional alternatives – and apply different post-processing algorithms on top. Even two services using identical raw model output will diverge based on their local correction methods. A 2-5°C temperature difference or a different rain probability for the same hour is normal and reflects processing choices, not data error.
What is the ECMWF model and why is it considered reliable?
ECMWF – the European Centre for Medium-Range Weather Forecasts – is an independent intergovernmental organisation that runs one of the most accurate global numerical weather models available. Its forecasts are particularly reliable in the 5-10 day range. The model's output is used by forecast services worldwide and runs on supercomputing infrastructure among the largest dedicated to atmospheric science.
How does MeteoFlow decide which data sources to use for a given location?
Source selection depends on coverage and data freshness for the specific coordinates. Global models like ECMWF and GFS provide the baseline; regional radar fills in precipitation detail; local station readings add ground-level accuracy where stations exist nearby. Priority goes to whichever source has the shortest data lag for that location at the time of the forecast.


