What Is a Low-Pressure Area?
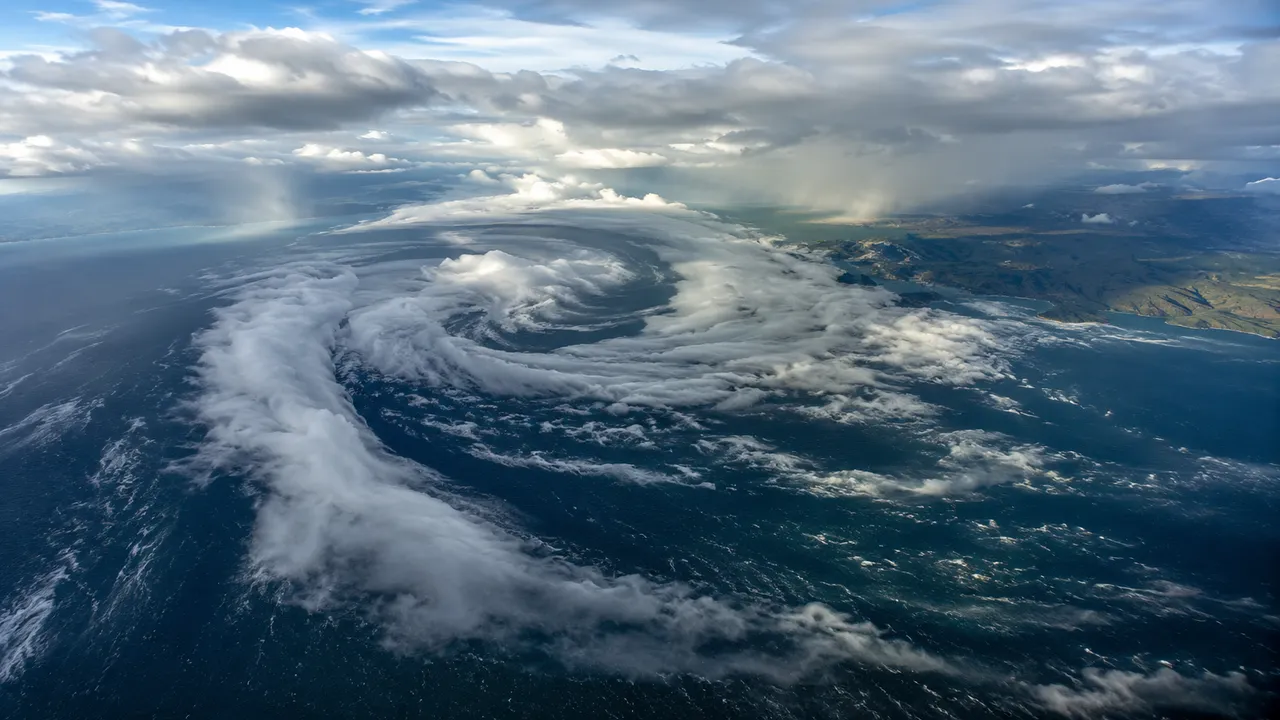
A reading of 990 hPa at one location while the surrounding area holds 1,010 hPa – that gap is what is low pressure area in practical terms (standard sea-level pressure sits at around 1,013 hPa). The air around it moves toward the lower reading, rises, and the low pressure area means something specific for the forecast: cloud, wind, and usually precipitation are more likely than not.
The Atmospheric Process Behind a Low-Pressure Area
What causes low pressure area to form differs by situation. Heat, colliding air masses and jet stream dynamics each produce one through a different route.
Surface Heating and Rising Air
The Thar Desert in June sits under one of the most persistent thermal lows on Earth. Ground temperatures exceed 45°C across large stretches of Rajasthan; the air directly above heats, expands and rises. As that air column thins, surface pressure drops. The same mechanism plays out over any hot land surface on a summer afternoon – a backyard thunderstorm cell and a continental heat low share the same starting point, just at vastly different scales.
Rising air cools at roughly 10°C per 1,000 metres. When it reaches the dew point – the temperature at which moisture starts condensing – a cloud begins forming. A dry thermal low over desert produces little of this; a moist tropical system produces towering cumulonimbus from the same process.
Converging Air Masses, Fronts and Upper-Level Divergence
Jet streams at the top of the troposphere don't blow at constant speed. Where the flow accelerates out of a trough, air diverges at altitude – it spreads out faster than it arrives. The atmosphere below responds by pulling surface air inward to fill the gap, lowering surface pressure.
Where warm and cold air masses collide along a frontal boundary, the warmer, lighter air is forced upward over the denser cold air. That forced ascent feeds the same rising column. Many of the deepest mid-latitude lows develop when both mechanisms operate simultaneously – upper-level jet divergence above a surface frontal boundary.
How Winds Move Around a Low-Pressure System
Pressure difference sets the wind in motion. Earth's rotation determines which direction it ends up moving. Both matter, and they operate at different scales.
Pressure Gradients and Inward Airflow
A synoptic weather map shows isobars – closed lines of equal pressure – packed tightly around an intense low, spread wide around a weak one. Where low pressure area winds are strongest is exactly where those lines are closest together: the spacing directly indicates the pressure gradient, and the gradient determines wind speed.
At the surface, friction pulls winds slightly across the isobars toward the centre rather than along them. Higher up, above roughly 1,000 metres where friction drops away, winds run nearly parallel to the isobars. That surface crossing is not a minor detail – it is what feeds the inward convergence that keeps air rising at the centre and sustains the whole system.
The Coriolis Effect in Both Hemispheres
Tropical cyclones never form within about 5° of the equator. The reason is the Coriolis effect – the deflection that Earth's rotation imposes on all moving air. At the equator it effectively vanishes, so inward-flowing air has nothing to curve it into a rotating circulation.
Outside the equatorial band, Earth's rotation deflects moving air consistently – right in the Northern Hemisphere, left in the Southern. Air converging toward a Northern Hemisphere low curves rightward, and the accumulated deflection produces the counterclockwise spiral visible on satellite imagery. Southern Hemisphere lows spin clockwise.
What Weather Does a Low-Pressure Area Bring?

Rising air is the one consistent feature. Everything else – cloud type, rainfall intensity, wind strength, temperature – depends on what the rising air carries and how fast the system is moving.
The Met Office describes the contrast directly: rising air produces cloud and precipitation; sinking air produces clear conditions. Their overview of high and low pressure systems sets out how the two pressure states produce opposite weather outcomes through opposite vertical motion.
Clouds, Precipitation and Strong Winds
Two lows reading 992 hPa at their centres can produce entirely different conditions. One sitting over the North Atlantic in January with isobars packed 50 kilometres apart drives gale-force winds, heavy rain and 6-metre waves. Another drifting across central Europe in August with isobars spaced 200 kilometres apart produces a grey afternoon and light drizzle. The pressure value at the centre is less informative than the gradient around it.
Rain begins when rising air cools past the dew point and condensation builds into cloud deep enough to produce precipitation. Snow requires the same process with temperatures below freezing through most of the column. Strong winds require a steep gradient. None of these are guaranteed by low pressure alone.
Why Low-Pressure Systems Can Contain Both Warm and Cold Air
Low pressure area temperature at the surface has no fixed relationship with the pressure reading. A mid-latitude cyclone carries a warm sector – a wedge of mild, moist air between its warm front ahead and cold front behind. Inside that warm sector, surface temperatures can run 10°C above what arrives after the cold front passes an hour later. Both air masses belong to the same low-pressure system.
A cut-off low drawing polar air southward over Europe in spring produces cold, showery weather with snow possible at low elevations. A thermal low over the Sahara contains air exceeding 40°C at the surface with almost no moisture. Low pressure area temperature ranges from below freezing to desert heat depending entirely on origin and trajectory.
What Is the Difference Between a Low-Pressure Area and a Tropical Cyclone?
On 12 October 1979, a US Air Force reconnaissance aircraft recorded 870 hPa in the eye of Typhoon Tip – the lowest sea-level pressure Guinness World Records has confirmed. Winds reached 305 km/h across a circulation 2,220 kilometres wide. A 1,005 hPa depression bringing grey skies to northern France on a Tuesday sits in the same pressure category.
The difference is fuel. A cyclone low pressure area draws energy from ocean water above roughly 26°C; cut off that heat source and the storm collapses within days. Mid-latitude lows run on temperature contrasts between air masses and need no warm ocean at all. A low pressure area is called a tropical depression, storm or cyclone depending on wind speed – 63 km/h and 117 km/h mark the thresholds between classifications.
Where Is a Low-Pressure Area on a Weather Map?
The letter "L" marks the centre on a synoptic chart. Isobars circle around it, tightening toward the middle. In the Northern Hemisphere, a cold front trails southwest and a warm front extends southeast – these fronts mark where the air mass boundaries cut across the circulation.
Watching how the isobar spacing changes between consecutive forecast charts tells more than the centre pressure alone. Tightening isobars mean an intensifying system; relaxing ones mean it is filling and weakening. Following a local weather forecast that tracks current pressure alongside wind, precipitation and cloud conditions shows how a specific low is evolving for any given location.
Rising air, convergence at the surface, upper-level divergence in the jet stream and pressure differences between neighbouring air masses all contribute to forming a low. Its actual weather depends on moisture, temperature, the fronts running through it, the steepness of the gradient and how fast the whole system is moving.
FAQ
How long can a low-pressure system last?
Three to seven days covers most mid-latitude lows before they fill or get absorbed. Cut-off lows are different – once they detach from the jet stream, there is no steering flow to move them along. Some sit over the same region for ten days or longer, delivering rainfall totals that a faster-moving system of equivalent depth would never accumulate in one place.
What is the lowest sea-level atmospheric pressure ever recorded?
870 hPa, confirmed by Guinness World Records. A US Air Force reconnaissance aircraft measured it in the eye of Typhoon Tip on 12 October 1979, approximately 483 kilometres west of Guam. The storm's circulation at peak intensity covered roughly 2,220 kilometres across – a diameter wider than the continental United States from coast to coast, making it the largest tropical cyclone ever observed.
Can a low-pressure system remain stationary?
Yes, and the mechanism is usually external. When high-pressure blocking patterns surround a low, the steering currents that would normally carry it eastward stall. Cut-off lows that separate from the main jet stream flow are particularly prone to this. Stationary lows over mountainous terrain can also anchor in place as topography interferes with their movement.
Can changes in atmospheric pressure affect the human body?
Some people consistently report headaches and joint discomfort before storms arrive. Research points to the rate of pressure change rather than the absolute value as the more relevant factor – a rapid 10 hPa drop over a few hours appears more likely to produce symptoms than a slow decline of the same amount. Individual sensitivity varies enough that no universal threshold has been established.


